Review of the laptop Apple MacBook Pro 14 "(Late 2021) on SoC Apple M1 Pro
Review of the laptop Apple MacBook Pro 14 "(Late 2021) on SoC Apple M1 Pro
Contents
show
At the end of last year, we told you about Apple’s top laptop – the 16-inch MacBook Pro with the Apple M1 Max chip. Testing it, we were convinced of the high performance of this model, which overtook not only all mobile predecessors, but even the 27-inch flagship iMac based on the Intel platform. But at the same time, the question remained unanswered: how much is the performance difference between the M1 Max and M1 Pro? How big is the gap between the most expensive and the most affordable configuration? Now we can get to the bottom of this by getting another hero from Apple’s latest presentation to test, the 14-inch MacBook Pro powered by the Apple M1 Pro SoC.
We told you about the configuration options for the new MacBook Pro in the material following the presentation, so we will not repeat ourselves. But we remind you that when ordering on the Apple website, you can fill the laptop with accessories, regardless of the screen diagonal. That is, to put it simply, the 14-inch MacBook Pro can have the most powerful stuffing, and the 16-inch one can have the most budgetary one. And vice versa. With one exception: A 16-inch MacBook Pro with M1 Max cannot have an SSD smaller than 1TB.
In our case, the model was equipped with a minimum amount of RAM, and the SoC was with a basic set of CPU and GPU cores. And the capacity of the SSD was only 512 GB. On the Apple website, such a configuration cost almost $3,800 as of early 2022, while the top version tested earlier cost $595,000! True, it is more correct to compare models with an equal volume of SSD, since it accounts for a significant part of the difference. So, if the MacBook Pro 14″ starting configuration is equipped with a 1TB SSD, then it will cost almost $4200 (prices for the same period of time). And the MacBook Pro 16″ with the most productive stuffing and the same 1 TB of storage will cost 375 thousand. It’s still very significant. Well, the last option: we add the most productive SoC and the maximum amount of RAM to the MacBook Pro 14″ – and we get the price of $6800. That is, for an enlarged display, an additional charge of $ 400. But still, what will be the real performance difference between the two polar configurations? Let’s figure it out.
Characteristics
Below is the configuration of the exact model that came to us for testing.
| MacBook Pro 14″ (Late 2021) | ||
|---|---|---|
| Processor | Apple M1 Pro 8 cores (6 high performance and 2 energy efficient) | |
| Graphics Accelerator | Apple M1 Pro, 16 cores | |
| RAM | 16 GB with 400 GB/s bandwidth | |
| Screen | Liquid Retina XDR 14.2″ 3024×1964 | |
| Sound subsystem | 6-speaker Hi-Fi system including low-frequency with resonance suppression, support for spatial audio when playing video with sound in Dolby Atmos | |
| SSD | 512 GB | |
| Optical drive | none | |
| Cardreader | Yes (SDXC) | |
| Network interfaces | Wired network | none |
| Wireless | Wi-Fi 6 (802.11b/g/n/ac/ax) | |
| Bluetooth | Bluetooth 5.0 | |
| Interfaces and Ports | USB Type A | none |
| Thunderbolt 4 / USB 4.0 | 3 (with USB-C connectors) | |
| HDMI | yes (full size, 1.4) | |
| Microphone input | yes (combined with headphone output) | |
| Headphone output | yes (combined with microphone input) | |
| VoIP | Webcam | yes (FaceTime 1080p with video stream processing via Apple M1 Max chip) |
| Microphone | yes (a system of three directional microphones with a high signal-to-noise ratio) | |
| Battery | 70 Wh | |
| Overall dimensions (width / height / depth of stand) | 313×221×16 mm | |
| Mass | 1.61 kg | |
Information about this model in the macOS operating system:
So, the basis of the MacBook Pro that came to us for testing is the single-chip system (SoC) Apple M1 Pro, which has 6 high-performance processor cores and 2 more energy-saving ones. As is the case with other models based on Apple Silicon, the manufacturer does not indicate the frequency of CPU cores.
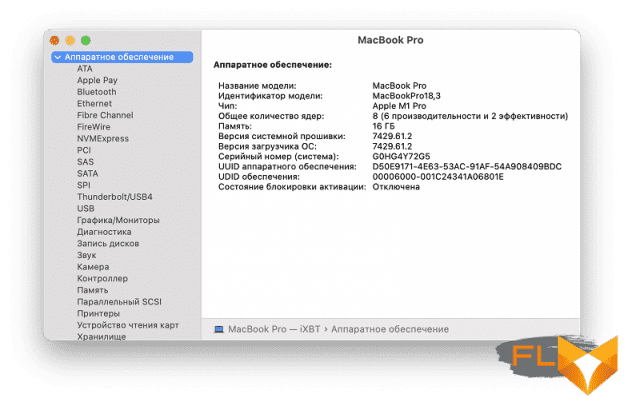
The Geekbench 5 benchmark defines the CPU frequency as 3.22 GHz.
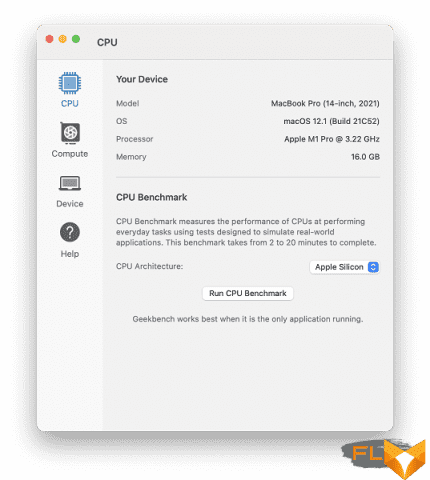
Almost the same, according to Geekbench, the Apple M1 had 3.2 GHz. However, these data should be trusted with caution.
Recall: M1 Pro (as well as its older brother M1 Max) became the heir to the Apple M1. All of them belong to the Apple Silicon family and are built on the ARM architecture. Each chip includes everything you need at once: processor cores, graphics cores (there were 8 or 7 of them in M1, up to 32 in M1 Pro / Max), RAM (on the same substrate) and cores of the Neural Engine machine learning system. There is no discrete graphics in models with Apple Silicon.
The amount of LPDDR4 RAM in our model is 16 GB, the SSD capacity is 512 GB. This is a basic option, available not only when ordering on the Apple website.
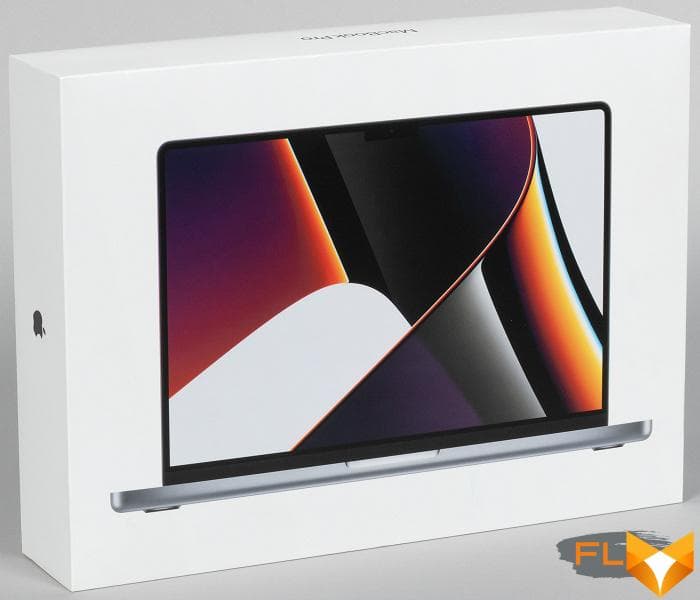
Packaging
The packaging of the MacBook Pro 14″ is outwardly identical to the older model. Even the drawing is the same. The only difference is the size of the box.
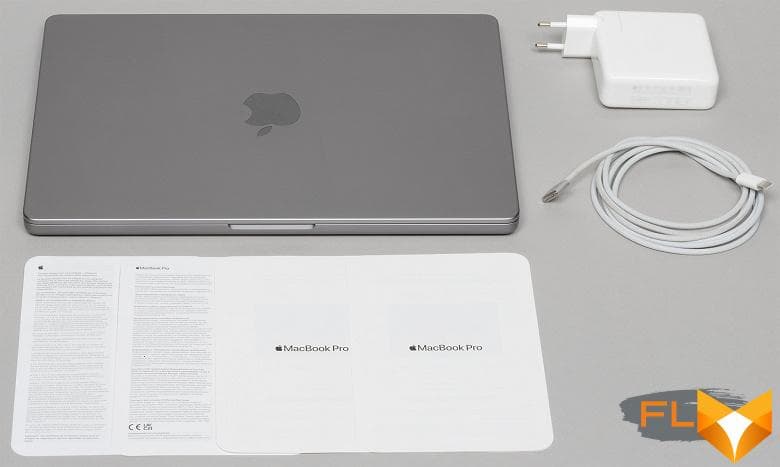
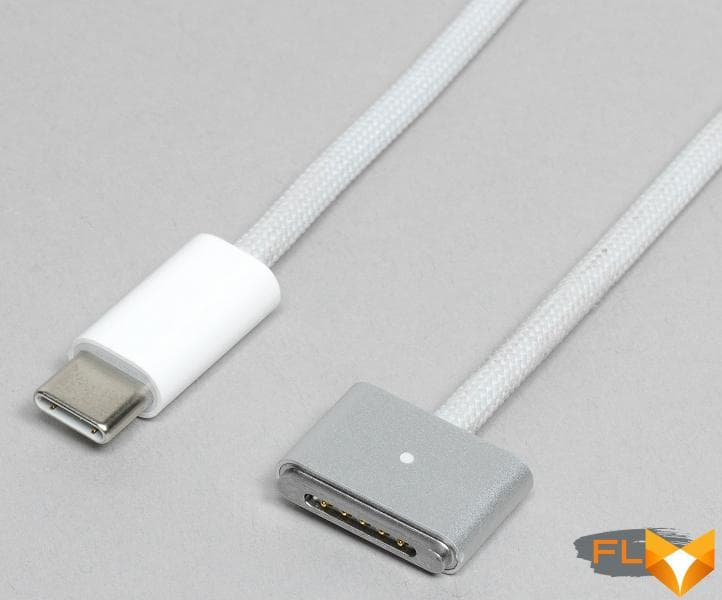
There are no surprises in the package: like the MacBook Pro 16″, the MacBook Pro 14″ cable with MagSafe 3 magnetic connector has a fabric braid. This is very cool, because the chafing of the cable was a common problem – now it is theoretically more durable.
As a reminder, MacBooks can still be charged via USB-C ports, but MagSafe is more reliable and enjoyable in every way.
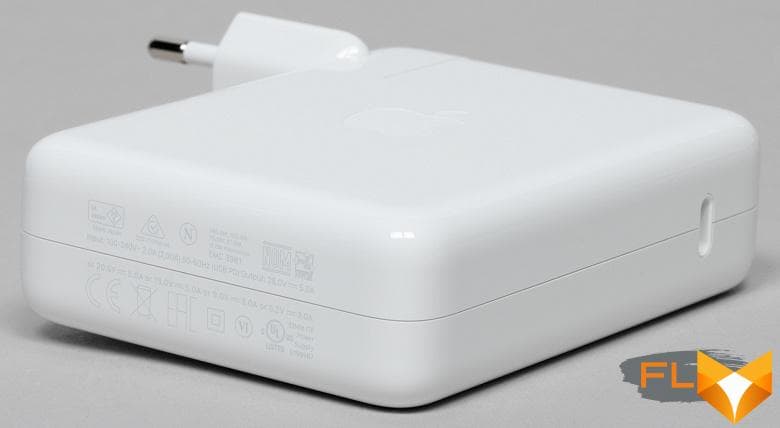
Along with the cable, there is a powerful 96 W charging block (however, a 140-watt block was included with the MacBook Pro 16″).
As for the rest, there is nothing to add to what was said earlier about the packaging of the MacBook Pro 16″.
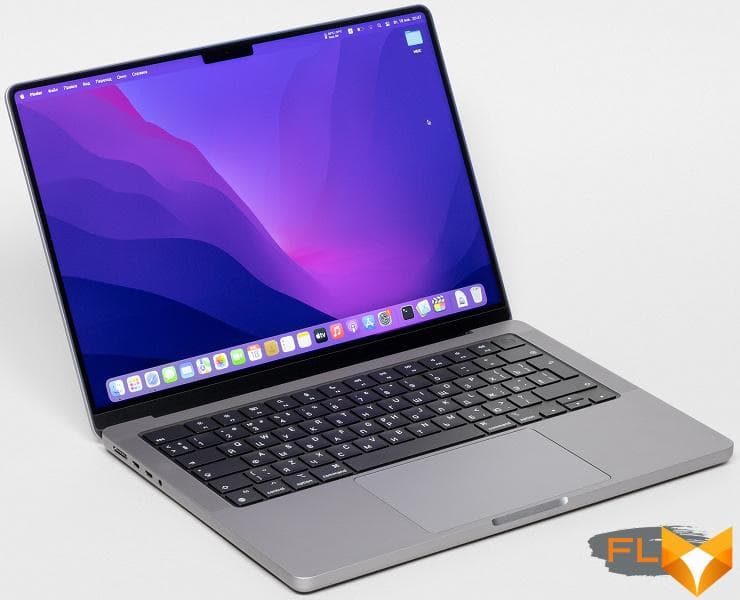
Design
The design of the MacBook Pro 14″ is exactly identical to the older model – of course, adjusted for the size of the display and overall dimensions. Yes, because of them, it seems even thicker and weirder – as if we are not facing the latest device, but something from the middle of the last decade. But this impression remains, of course, until you open the lid of the MacBook.

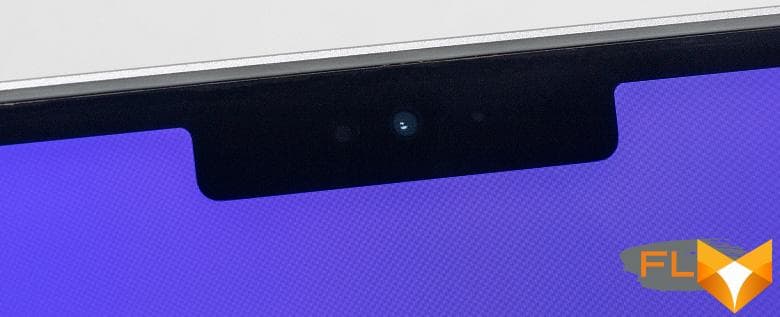
Then, firstly, the minimum dimensions of the frame around the screen are striking, and secondly, the “bangs”, the dead zone at the top center, where the front camera is located.
We discussed both in detail in the review of the MacBook Pro 16″, so we will not repeat ourselves.
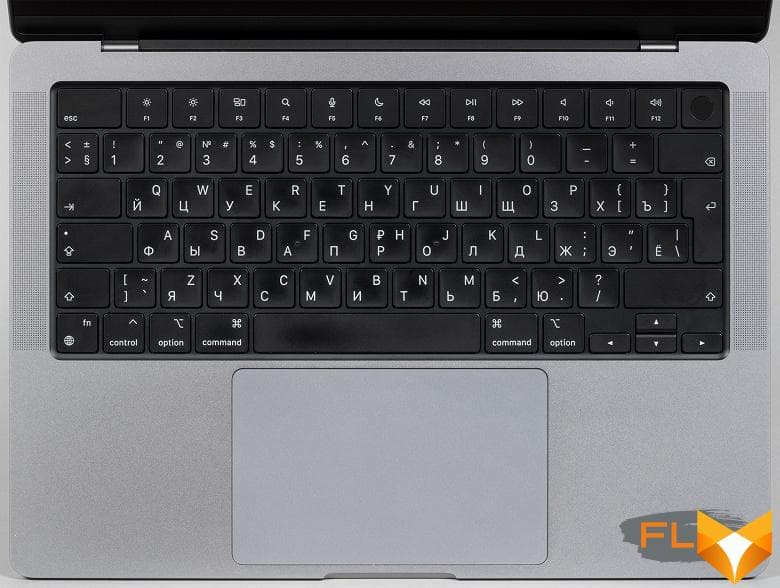
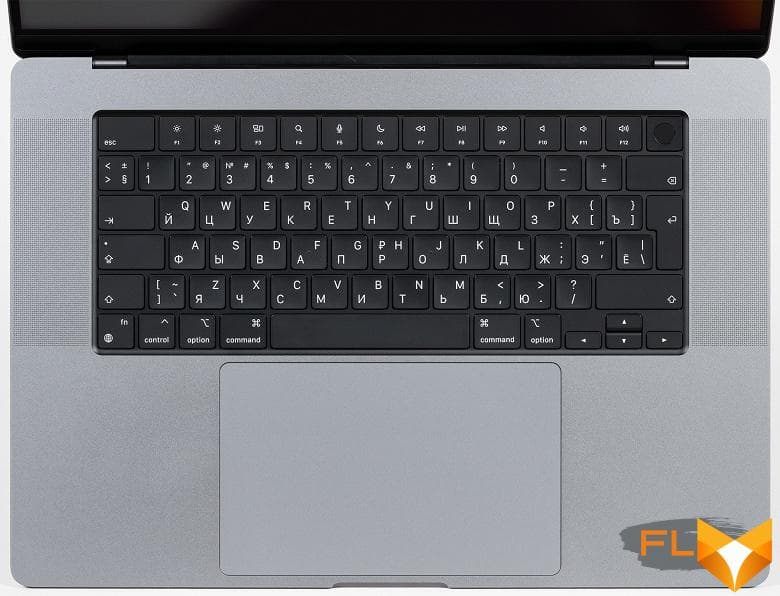
We only add that the size of all keys and the keyboard layout of the models are identical, and space savings in the case of a 14-inch laptop is achieved by reducing the grids above the speakers on the sides. In addition, a more compact device has a smaller touchpad. Compare photos of MacBook Pro 14″…
…and the MacBook Pro 16″.
In general, the design of both new models seems to us to be significant in many respects. And it’s not just about the return of previously removed connectors and slots (full-size HDMI, SD) and a magnetic connector for charging, which looks like an unequivocal recognition of the fallacy of the past course, but also that Apple for the first time preferred functionality and practical advantages to a spectacular appearance and desire for minimum thickness.
In principle, it is quite logical for devices with the Pro prefix. Think back to the ditching of the original cylindrical design of the 2013 Mac Pro (popularly known as the “bucket”) in favor of the more familiar and easy-to-take apart 2019 model, reminiscent of the very first Mac Pros. Now the same thing happened with laptops.
Sound
The loudness of the built-in loudspeakers was measured while playing an audio file with pink noise. The maximum volume was equal to 77.1 dBA. Among laptops tested up to the time of this writing (median 74.4 dBA), this laptop is louder than average.
| Model | Loudness, dBA |
|---|---|
| MSI P65 Creator 9SF | 83.0 |
| Apple MacBook Pro 13″ (A2251) | 79.3 |
| MSI GE76 Raider 11UH | 79.0 |
| Asus ROG Zephyrus S17 | 77.5 |
| HP Omen 15-ek0039ur | 77.3 |
| Apple MacBook Pro 14″ (Late 2021) | 77.1 |
| Dell Latitude 9510 | 77.0 |
| MSI Bravo 17 A4DDR | 76.8 |
| Apple MacBook Air (Early 2020) | 76.8 |
| MSI Stealth 15M A11SDK | 76.0 |
| MSI GP66 Leopard 10UG | 75.5 |
| Apple MacBook Pro 13″ (Apple M1) | 75.4 |
| Asus VivoBook S533F | 75.2 |
| Gigabyte Aero 15 OLED XC | 74.6 |
| Realme Book RMNB 1002 | 74.4 |
| MSI Katana GF66 11UG | 73.9 |
| Honor MagicBook Pro | 72.9 |
| LG gram 17Z90P | 72.1 |
| Asus ROG Strix G732LXS | 72.1 |
| Lenovo Yoga Slim 7 Pro 14ACH5 | 72.0 |
| Lenovo IdeaPad 530S-15IKB | 66.4 |
| Asus ZenBook 14 (UX435E) | 64.8 |
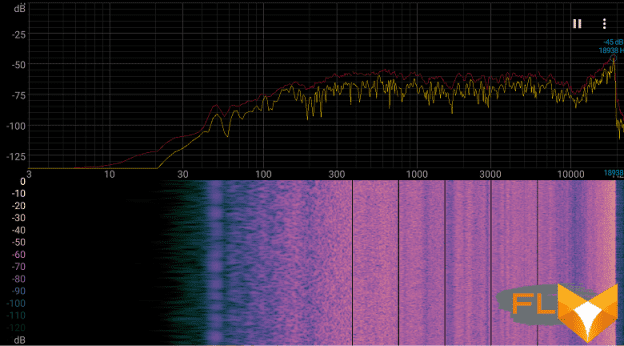
The spectrogram of white noise shows that there are no pronounced resonant peaks (but there are dips between the frequency bands, the largest is about 10 kHz), there are no expected low frequencies, in general, from low to not the highest frequency response is quite flat:
Screen
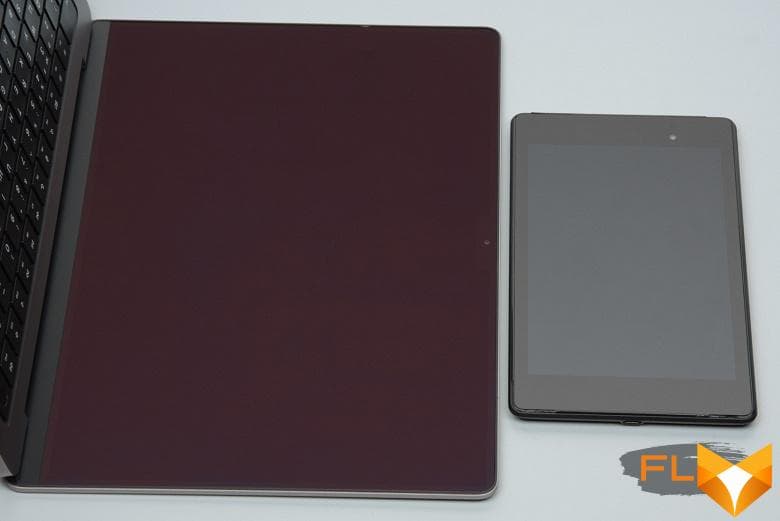
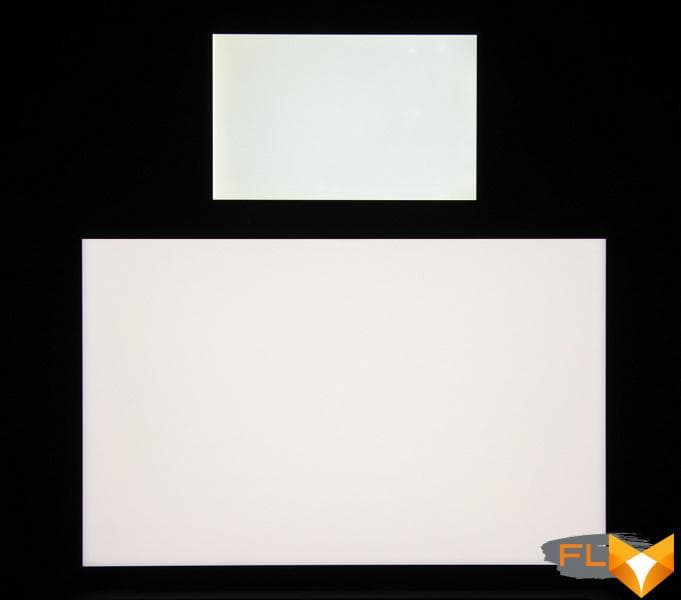
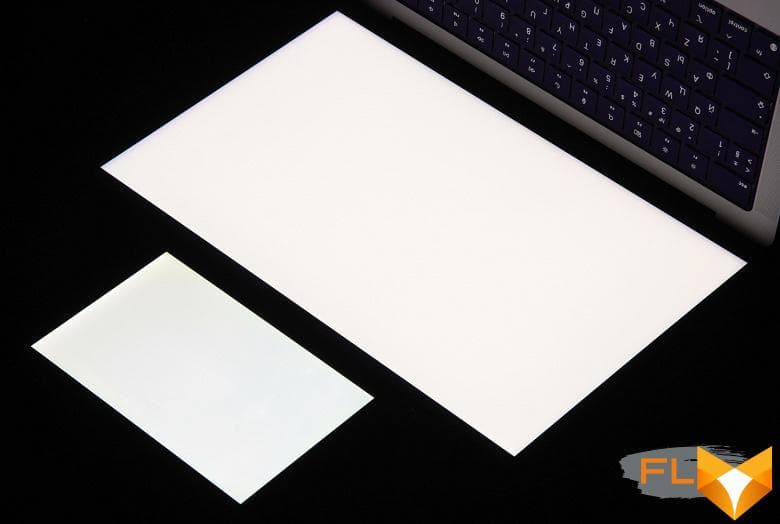
The front surface of the screen is made, apparently, of a glass plate, at least there are rigidity and scratch resistance. The screen is mirror-smooth on the outside and has weak oleophobic (grease-repellent) properties. The finger glides over the screen surface with less resistance, fingerprints do not appear so quickly, but are removed a little easier than in the case of ordinary glass. Judging by the brightness of the reflected objects, the anti-glare properties of the screen are noticeably better than those of the Google Nexus 7 (2013) (hereinafter simply Nexus 7). For clarity, here is a photo in which a white surface is reflected on the screens of both devices (it’s easy to figure out where what is):
Due to the difference in color tone and bezel color, it is difficult to visually judge which screen is darker. Let’s make it easy: convert the photo to grayscale and place the image of the central part of the Nexus 7 screen on the Apple MacBook Pro 14″ (2021) screen image. Here’s what happened:

Now you can clearly see how dark the screen of the Apple MacBook Pro 14″ (2021) is. From a practical point of view, the anti-glare properties of the screen are so good that even direct reflection of bright light sources does not interfere much with work. We did not find any significant doubling of objects reflected on the screen, that is, there is no air gap in the screen layers, which, however, is expected for a modern LCD screen without a touch layer.
With manual brightness control, its maximum value in SDR mode was about 490 cd / m², with the minimum brightness adjustment value, the backlight turns off completely, and at the first step (if using the buttons) of adjustment from the minimum position, the brightness is 3.9 cd / m². As a result, at maximum brightness in bright daylight and even in direct sunlight (considering what was said above about anti-glare properties), the screen remains readable, and in complete darkness the screen brightness can be lowered to a comfortable level. There is an automatic brightness control according to the light sensor (it is located to the left of the front camera eye). In automatic mode, when the ambient light conditions change, the screen brightness both increases and decreases. The operation of this function depends on the position of the brightness adjustment slider – the user sets the desired brightness level under the current conditions. If nothing is changed, then in complete darkness the brightness drops to 50 cd / m² (in principle, it is normal, but it can be lower), in an office lit by artificial light (about 550 lux), the screen brightness is set to 380 cd / m² (also a little high, but not critical), in a very bright environment (conditionally in direct sunlight) rises to 490 cd / m² (to the maximum, as it should be). We were not entirely satisfied with the result, so in the dark we lowered the brightness, and for the above three conditions we got 10, 380 and 490 cd / m² (will do). It turns out that the auto-brightness function works adequately, and it is possible to adjust the nature of the brightness change to the user’s requirements.
In HDR mode (that is, for HDR content – we used test clips that were played using QuickTime), the maximum brightness reaches about 1570 cd / m² for not very large areas and about 1150 cd / m² for large areas of white. This is consistent with the manufacturer’s data:
Brightness: up to 1000 cd/m² full screen and 1600 cd/m² peak
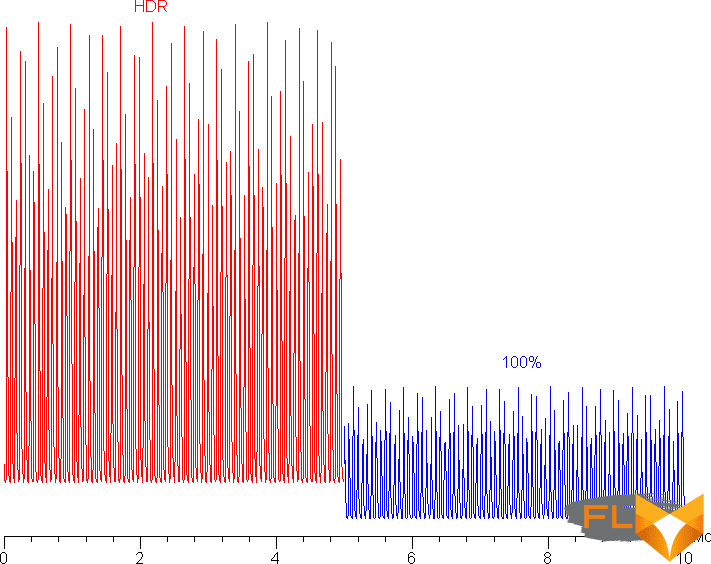
At any brightness level, there is significant backlight modulation, but its frequency is very high – about 15 kHz – so there is no screen flicker. Here are graphs of brightness (vertical axis) versus time (horizontal axis) at a brightness setting of 100% in SDR mode and with approximately 10% white output at maximum brightness in HDR mode:
This Apple MacBook Pro 14″ (2021) uses an IPS type matrix. Micrographs show a typical IPS subpixel structure:
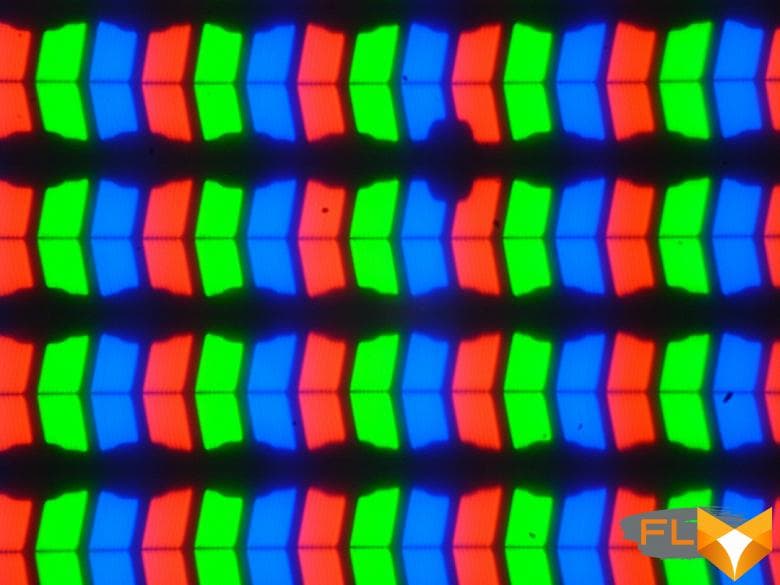
For comparison, you can see the gallery of microphotographs of screens used in mobile technology.
The screen has good viewing angles without significant color shift even at large deviations of the gaze from the perpendicular to the screen and without inverting shades. For comparison, here are photographs in which the same images are displayed on the screens of the Apple MacBook Pro 14 ″ (2021) and Nexus 7, while the brightness of the screens is initially set to about 200 cd / m² (on a white field in full screen), and the color balance on the camera forcedly switched to 6500 K. White field perpendicular to the screens:
Note the good uniformity of brightness and color tone of the white field. And a test picture:

The color reproduction is good and the colors are moderately saturated on both screens, the color balance is slightly different. Recall that the photo cannot serve as a reliable source of information about the quality of color reproduction and is provided only for a conditional visual illustration. The reason is that the spectral sensitivity of the camera matrix does not exactly match this characteristic of human vision. Now at an angle of about 45 degrees to the plane and to the side of the screen:

It can be seen that the colors did not change much on both screens, and the contrast remained at a high level. And the white box:
The brightness at this angle for both screens has noticeably decreased (exposure is increased by 5 times), but the screen of the Apple MacBook Pro 14″ (2021) is still slightly lighter.
The black field when deviated diagonally is highlighted very weakly, but it is difficult to show this, as well as the uniformity of black illumination, and the initial contrast of the matrix could not be determined, it is clearly high, but it is not clear how much.
The fact is that this screen is equipped with a direct multi-zone LED backlight: at the back, directly behind the LCD matrix, there is a matrix of backlight LEDs. Each of the LEDs or a group of LEDs that form one zone is controlled independently from the others. Potentially, this makes it possible to obtain good illumination uniformity over the screen area, as well as locally illuminate bright areas of the image and darken dark ones, thereby improving image contrast. Since there are many times fewer backlight zones than there are pixels in the matrix, each zone illuminates an area of thousands of pixels (in fact, the boundaries are not clear). Because of this, in some types of images, with a strong desire, you can see artifacts in the form of local illumination around or near bright objects. For example, in the case of a test image with white dots and a mouse cursor (for clarity, we increased the ISO and shutter speed):
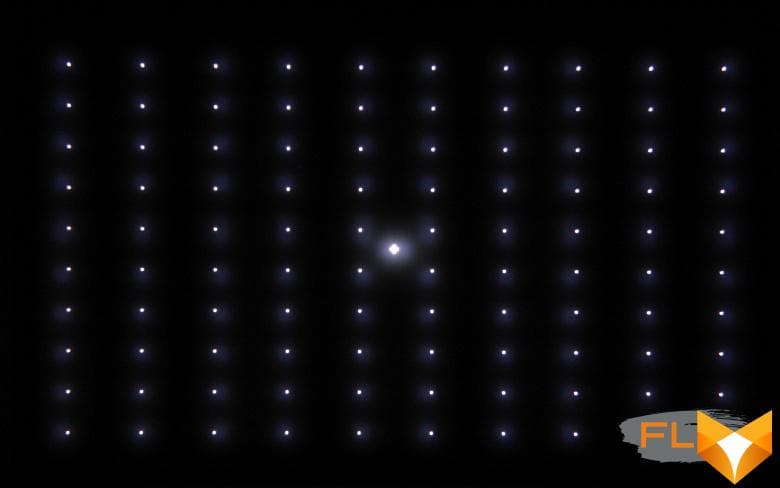
In fact, with normal use, artifacts from zonal illumination are not visible – the above image is perceived by the eye as just white dots with clear boundaries on a black background. Zone lighting is especially good for HDR images, as it allows you to locally increase the brightness to almost 1600 cd / m² and greatly reduce the brightness of dark areas, turning off the backlight completely in black areas. True, this behavior cannot be disabled, so it is not possible to correctly determine the contrast and, for example, the response time.
The gamma curve constructed from 32 points with an equal interval according to the numerical value of the shade of gray did not reveal a blockage either in the highlights or in the shadows. The exponent of the approximating power function is 2.21, which is very close to the standard value of 2.2. In this case, the real gamma curve deviates little from the power dependence:
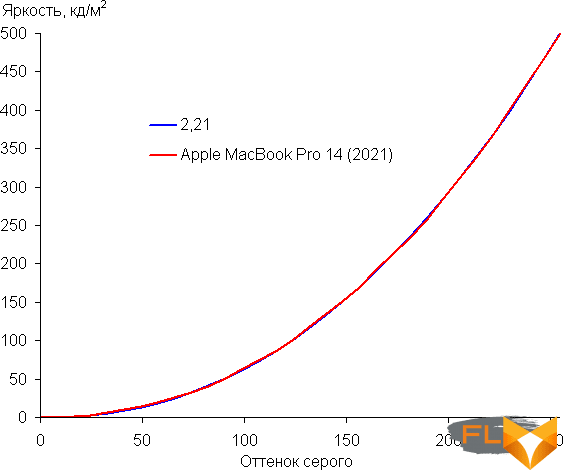
These and other results were obtained, unless otherwise noted, under the device’s native operating system without changing the initial screen settings and for test images without a profile or with an sRGB profile. Recall that in this case, the initial properties of the matrix are precisely corrected by software.
The color gamut is almost equal to sRGB:

The spectra show that the software correction mixes the primary colors to the right extent:
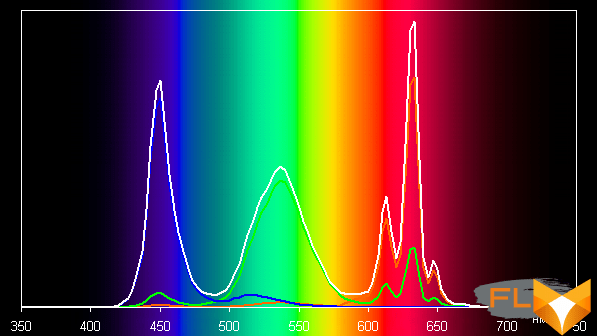
Note that such spectra are found in mobile and not very mobile devices from Apple and other manufacturers. Apparently, such screens use LEDs with a blue emitter and a green and red phosphor (usually a blue emitter and a yellow phosphor), which, in combination with special matrix light filters, allows you to get a wide color gamut. Yes, and in the red phosphor, apparently, the so-called quantum dots are used. For a consumer device that does not support color management, a wide color gamut is not an advantage at all, but a significant disadvantage, because as a result, the colors of images – drawings, photos and films – oriented to the sRGB space (and the vast majority of them) have an unnatural saturation. This is especially noticeable on recognizable shades, such as skin tones. In this case, color management is present, so the output of images in which the sRGB profile is registered or no profile is registered at all is performed with gamut correction to sRGB. As a result, visually the colors have a natural saturation.
Native to many modern Apple devices is the Display P3 color space, with slightly richer greens and reds than sRGB. The Display P3 space is based on SMPTE DCI-P3 but has a D65 white point and a gamma curve of approximately 2.2. Indeed, by supplementing the test images (JPG and PNG files) with a Display P3 profile, we got a color gamut exactly equal to DCI-P3:
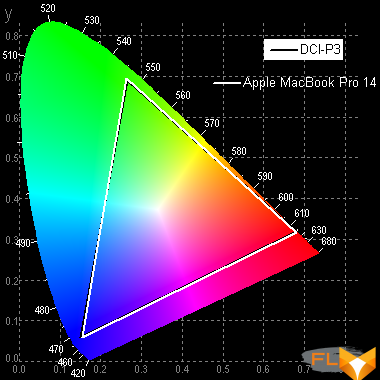
We look at the spectra in the case of test images with the Display P3 profile:
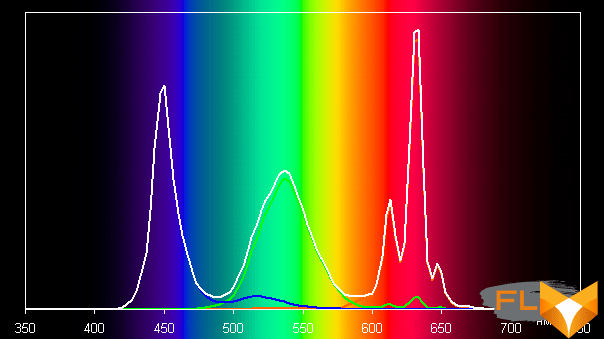
It can be seen that in this case there is only minimal cross-mixing of components, that is, the original color space for the Apple MacBook Pro 14″ (2021) screen matrix is almost equal to Display P3.
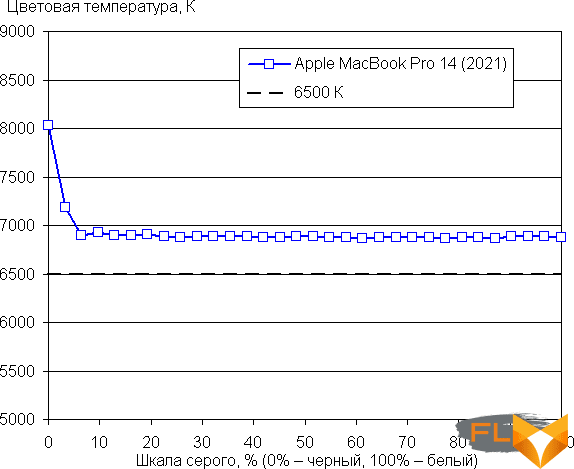
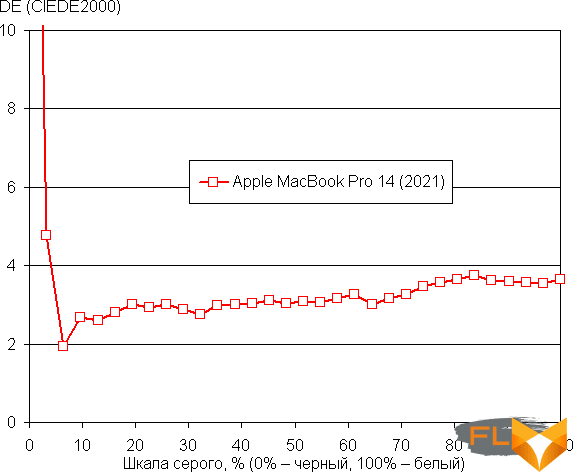
The balance of shades on the gray scale is good, since the color temperature is quite close to the standard 6500 K, and the deviation from the blackbody spectrum (ΔE) is less than 10, which is considered acceptable for a consumer device. At the same time, the color temperature and ΔE change little from shade to shade – this has a positive effect on the visual assessment of color balance. (The darkest areas of the gray scale can be ignored, since the color balance does not matter much there, and the measurement error of color characteristics at low brightness is large.)
This Apple device has the already familiar Night Shift function, which makes the picture warmer at night (how warmer the user indicates, the real range is from 6300 K to 2750 K). For a description of why this correction might be useful, see the iPad Pro 9.7″ article. In any case, when entertaining with a laptop at night, it is better to lower the screen brightness to a low, but still comfortable level, rather than distort the colors.
There is a function True Tone, which, if enabled, adjusts the color balance to the environment. We enabled this feature and tested how it works:
| Conditions | Color temperature on white margin, K | ΔE on a white box |
|---|---|---|
| True Tone disabled | 6900 | 2,6 |
| True Tone on, cool white LED fixtures (6800K) | 7150 | 4,3 |
| True Tone on, incandescent halogen lamp (warm light – 2850K) | 5550 | 4,3 |
With a strong change in lighting conditions, the adjustment of the color balance is weak, so from our point of view, this function does not work as it should. Note that the current standard is to calibrate display devices to a white point of 6500 K, but in principle, correction for the color temperature of external light can be useful if you want to achieve a better match between the image on the screen and what is seen on paper (or on any media on which colors are formed by reflecting incident light) under current conditions.
Let’s summarize. The screen of the Apple MacBook Pro 14″ (2021) laptop has a high maximum brightness (490 cd/m² in SDR mode and up to 1570 cd/m² in HDR mode) and has excellent anti-glare properties, so the device can be used outdoors even on a sunny summer day without any problems , and HDR videos look great. In complete darkness, the brightness can be reduced to a comfortable level (up to 3.9 cd / m²). It is permissible to use the mode with automatic brightness adjustment, which works adequately. The advantages of the screen include the absence of backlight flicker, good black stability to deviation of the gaze from the perpendicular to the screen plane, high contrast and excellent local brightness adjustment. In conjunction with support from the OS, on the screen of the Apple Apple MacBook Pro 14 ″ (2021), by default, images with or without the prescribed sRGB profile are displayed correctly (it is believed that they are also sRGB), and images with a wider coverage are possible within the scope DisplayP3. The screen has no flaws. At the moment, this is one of the best displays among all laptops.
Video playback
To test the display of video files on the screen of the device itself, we used a set of test files with an arrow and a rectangle moving one division per frame (see “Methodology for testing video signal playback and display devices. Version 1 (for mobile devices)”). Screenshots with a shutter speed of 1 s helped to determine the nature of the output frames of video files with various parameters: resolution (1920 by 1080 (1080p) and 3840 by 2160 (4K) pixels) and frame rate (24, 25, 30, 50 and 60 fps) varied. With). The manufacturer for the screen of this laptop claims a new feature:
ProMotion technology with adaptive refresh rate up to 120Hz
Constant refresh rate: 47.95Hz, 48.00Hz, 50.00Hz, 59.94Hz, 60.00Hz
Here’s what it looks like in the screen settings:
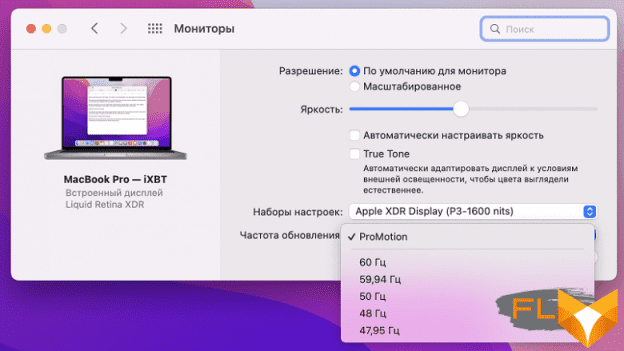
With fixed frequencies, everything is clear: whichever user chooses, this will be. For example, in the case of watching movies with 24 fps, it makes sense to select a frequency of 48 Hz (or 47.95 Hz), then the frames will be output at equal time intervals, which will slightly improve the perception of dynamic scenes. In the case of an adaptive refresh rate, intuitive expectations diverge from reality. In particular, when playing video using hardware decoding, if not in windowed mode, then at least in full screen mode, I would like to see the screen refresh rate adjust to the frame rate in the video file so that frames are always displayed with equal duration. But in fact, the result is far from expected, and besides, it depends on how and what to reproduce. For example, in the QuickTime player in full screen mode, there is a correct output of video files at 24 fps, but the output of all the others (25, 30, 50 and 60 fps) was with a periodic variation in the duration of the frames. Yes, even in the case of 60 fps, which is generally extremely strange. And in windowed mode and in the case of the VLC player, the refresh rate seems to be just fixed at 120 fps (tested on additional files at 75, 90, 100 and 120 fps) and does not change in any way.
The range of brightness displayed on the screen corresponds to the actual range for this video file. Note the support for hardware decoding of H.265 files with a color depth of 10 bits per color, while the output of gradients on the screen is carried out with better quality than in the case of 8-bit files. However, this is not a proof of 10-bit output. HDR file display is also supported (at least HDR10, HEVC).
Performance testing
We will test the performance of the MacBook Pro 14″ according to our current methodology. For comparison, here are the results of the MacBook Pro 16″ based on the M1 Max – Apple’s flagship laptop, iMac 24″ – the top device on M1, the previous MacBook Pro 16″ in the top configuration as the most powerful Apple laptop on an Intel processor and iMac 27″ in the same top configuration (as the most powerful monoblock on an Intel processor).
Our main task is to understand how the most affordable configuration on the M1 Pro is inferior to the most powerful one on the M1 Max, as well as how much it is faster than the M1 and top solutions on Intel.
Final Cut Pro X and Compressor
We start with the video editing and export software Final Cut Pro X and Compressor. At the time of testing, the current versions were 10.6 and 4.6, respectively. Previous generation models were tested on software versions 10.5 and 4.5, respectively, but this does not affect the results (we were able to verify this by updating FCPX and Compressor on one of the models that we used).
| MacBook Pro 14″ (Late 2021), Apple M1 Pro | MacBook Pro 16″ (Late 2021), Apple M1 Max | iMac 24″ (Early 2021), Apple M1 | MacBook Pro 16″ (Late 2019), Intel Core i9-9980HK | iMac 27″ (Mid 2020), Intel Core i9-10910 | |
|---|---|---|---|---|---|
| Test 1: 4K stabilization (min:sec) | 1:25 | 1:28 | 3:25 | 10:31 | 7:23 |
| Test 2: 4K rendering with Compressor (min:sec) | 6:43 | 6:58 | 7:24 | 5:11 | 5:11 |
| Test 3: Full HD stabilization (min:sec) | 6:11 | 5:04 | 10:19 | 10:18 | 7:32 |
| Test 4: Creating a proxy file from an 8K video (min:sec) | 0:28 | 0:20 | 1:11 | 1:36 | 1:19 |
| Test 5: 8K export to four Apple ProRes formats via Compressor (min:sec) | 1:55 | 0:37 | 4:38 | 9:52 | 1:45 |
And here’s a surprise: in operations with 4K, the MacBook Pro 14 ″ even slightly outperformed its older comrade. True, the difference is minimal, so this is most likely just a natural scatter of results. But, at least, we can definitely say that the novelty is not slower. But in the export of 8K to four formats, the lag of the M1 Pro from the top M1 Max in terms of the number of cores still turned out to be decisive and provided a huge difference in the results – not in favor of the Pro, of course.
3D modeling
The next block of tests is the operation of rendering 3D models using the Maxon 4D Cinema R25 program and the Cinebench R23 and R15 benchmarks of the same company. Please note that Cinebench R23 and Maxon 4D Cinema R25 are optimized for Apple Silicon, while Cinebench R15 is not.
| MacBook Pro 14″ (Late 2021), Apple M1 Pro | MacBook Pro 16″ (Late 2021), Apple M1 Max | iMac 24″ (Early 2021), Apple M1 | iMac 27″ (Mid 2020), Intel Core i9-10910 | Mac Pro (Late 2019), Intel Core W-3245 | |
|---|---|---|---|---|---|
| Maxon Cinema 4D Studio R25, render time, min:sec (less is better) | 1:34 | 1:12 | — | 0:52 | — |
| Cinebench R15, OpenGL, fps (more is better) | 91 | 94 | 88 | 170 | 138 |
| Cinebench R23, multi-core, pts, (more is better) | 8568 | 12371 | 7761 | 14273 | — |
Here the result is logical. The M1 Pro lags behind the M1 Max, but still slightly outperforms the regular M1.
Apple Pro Logic X
Our next test is Apple Pro Logic. We use Billie Eilish’s Ocean Eyes demo track. There is no comparison with the previous generation MacBook Pro 16″ and Mac Pro, because a different track was used before and the methodology was different.
| MacBook Pro 14″ (Late 2021), Apple M1 Pro | MacBook Pro 16″ (Late 2021), Apple M1 Max | iMac 24″ (Early 2021), Apple M1 | iMac 27″ (Mid 2020), Intel Core i9-10910 | |
|---|---|---|---|---|
| Apple Pro Logic X bounce (min:sec) | 4:14 | 3:41 | 6:31 | 4:22 |
And again, the lag behind the M1 Max is undeniable, but still not very dramatic. But even the youngest of the new laptops overtakes the most powerful 27-inch iMac. Isn’t this a miracle?
Compiling
| MacBook Pro 14″ (Late 2021), Apple M1 Pro | MacBook Pro 16″ (Late 2021), Apple M1 Max | iMac 24″ (Early 2021), Apple M1 | iMac 27″ (Mid 2020), Intel Core i9-10910 | |
|---|---|---|---|---|
| Xcode, benchmark (min:sec) | 1:42 | 1:49 | 2:11 | 2:19 |
And again, we are surprised at the alignment: M1 Pro is the formal leader.
Archive
| MacBook Pro 14″ (Late 2021), Apple M1 Pro | MacBook Pro 16″ (Late 2021), Apple M1 Max | iMac 24″ (Early 2021), Apple M1 | iMac 27″ (Mid 2020), Intel Core i9-10910 | |
|---|---|---|---|---|
| Keka 1.2.3 (version from Mac App Store), min:sec | 3:20 | 3:13 | 5:22 | 4:21 |
But in the archiving operation, it still lagged behind the M1 Max, but again so insignificantly that the results can be described as almost equal.
Video encoding
The next “real” task is video encoding with HandBrake. We used version 1.4.2 – optimized for Apple Silicon.
| MacBook Pro 14″ (Late 2021), Apple M1 Pro | MacBook Pro 16″ (Late 2021), Apple M1 Max | iMac 24″ (Early 2021), Apple M1 | iMac 27″ (Mid 2020), Intel Core i9-10910 | |
|---|---|---|---|---|
| HandBrake 1.4.2 (file conversion, min:sec) | 4:11 | 3:17 | — | 3:20 |
Even this optimization did not help the M1 Pro overtake the iMac 27″ on Intel. The lag behind the M1 Max can also be recognized as significant.
Office Applications
| MacBook Pro 14″ (Late 2021), Apple M1 Pro | MacBook Pro 16″ (Late 2021), Apple M1 Max | iMac 24″ (Early 2021), Apple M1 | iMac 27″ (Mid 2020), Intel Core i9-10910 | |
|---|---|---|---|---|
| Numbers (file open, min:sec) | 2:52 | 3:24 | 2:11 | 3:46 |
In the benchmark run in Numbers, the results are completely inexplicable. For some reason, the M1 turns out to be the fastest, then the M1 Pro and the last one is the M1 Max. And it should be exactly the opposite.
JetStream
| MacBook Pro 14″ (Late 2021), Apple M1 Pro | MacBook Pro 16″ (Late 2021), Apple M1 Max | iMac 24″ (Early 2021), Apple M1 | MacBook Pro 16″ (Late 2019), Intel Core i9-9980HK | iMac 27″ (Mid 2020), Intel Core i9-10910 | |
|---|---|---|---|---|---|
| JetStream 2 points (more is better) | 208 | 208 | 177 | 152 | 206 |
In the JetStream 2 JavaScript browser benchmark (using Safari as the browser), the new MacBook Pros have parity.
Geekbench 5
| MacBook Pro 14″ (Late 2021), Apple M1 Pro | MacBook Pro 16″ (Late 2021), Apple M1 Max | iMac 24″ (Early 2021), Apple M1 | MacBook Pro 16″ (Late 2019), Intel Core i9-9980HK | iMac 27″ (Mid 2020), Intel Core i9-10910 | |
|---|---|---|---|---|---|
| Single-core 64-bit mode (more is better) | 1763 | 1770 | 1738 | 1150 | 1291 |
| Multi-core 64-bit mode (more is better) | 9975 | 12735 | 7674 | 7209 | 10172 |
| Compute OpenCL (more is better) | 34335 | 62163 | 19365 | 27044 | 56181 |
| Compute Metal (more is better) | 37754 | 68878 | 21651 | 28677 | 57180 |
In Geekbench 5, the new MacBook Pro 14″ only slightly loses in single-core mode, but in multi-core mode and GPU computing, it is significantly inferior to the MacBook Pro 16″ with M1 Max.
GFXBenchmark Metal
Now let’s take a look at the Offscreen tests in GFXBenchmark Metal.
| MacBook Pro 14″ (Late 2021), Apple M1 Pro | GFXBenchmark for Mac on MacBook Pro 16″ (Late 2021), Apple M1 Max | GFXBenchmark for Mac on iMac 24″ (Early 2021), Apple M1 | GFXBenchmark for Mac on iMac 27″ (Mid 2020), Intel Core i9-10910 | |
|---|---|---|---|---|
| GFXBenchmark 1440р Aztec Ruins (High Tier Offscreen) | 147 fps | 310 fps | 81 fps | 195 fps |
| GFXBenchmark 1080p Aztec Ruins (Normal Tier Offscreen) | 395 fps | 757 fps | 215 fps | 490 fps |
| GFXBenchmark 1440p Manhattan 3.1.1 Offscreen | 243 fps | 487 fps | 131 fps | 382 fps |
| GFXBenchmark 1080p Manhattan 3.1 Offscreen | 495 fps | 944 fps | 273 fps | 625 fps |
| GFXBenchmark 1080p Manhattan Offscreen | 816 fps | 1281 fps | 403 fps | 798 fps |
Here the difference between the M1 Pro and M1 Max is almost double. But the M1 Pro has a similar lead over the M1. But the top-end monoblock on Intel is still ahead of the M1 Pro.
Games
For performance testing in games, we use the built-in Civilization VI benchmark. It outputs two metrics: Average Frame Time and 99th Percentile.
For clarity, we translate the result in milliseconds into fps (this is done by dividing 1000 by the resulting value). Default settings.
| MacBook Pro 14″ (Late 2021), Apple M1 Pro | MacBook Pro 16″ (Late 2021), Apple M1 Max | iMac 24″ (Early 2021), Apple M1 | MacBook Pro 16″ (Late 2019), Intel Core i9-9980HK | iMac 27″ (Mid 2020), Intel Core i9-10910 | iMac 27″ (Mid 2020), Intel Core i9-10910 | |
|---|---|---|---|---|---|---|
| Civilization VI, Average Frame Time, fps | 21,4 | 21,6 | 20,9 | 41,3 | 49.7 | 44,4 |
| Civilization VI, 99th Percentile, fps | 12,9 | 12.5 | 11,4 | 17,3 | 23,9 | 21,9 |
The result for M1 Pro and M1 Max is almost the same.
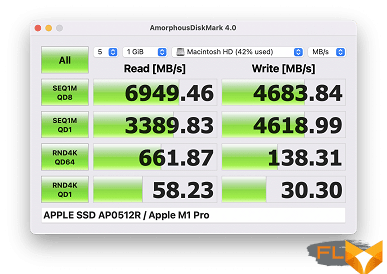
Drive speed
If the benchmarks listed above help us evaluate the performance of the CPU and GPU, then BlackMagic Disk Speed is focused on testing the drive: it measures the speed of reading and writing files.
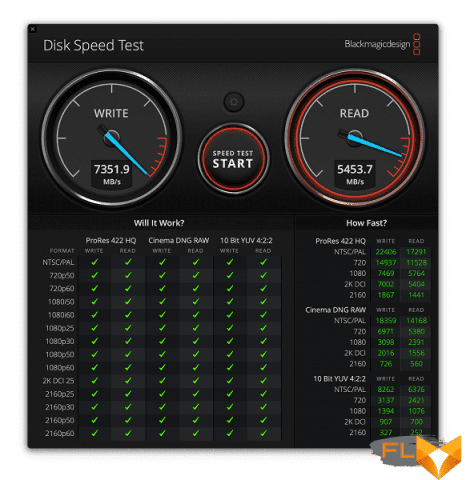
Well, the SSD in the entry-level Pro range is significantly slower than the flagship – at least in write operations. On the other hand, this result is still better than that of desktops.
| MacBook Pro 14″ (Late 2021), Apple M1 Pro | MacBook Pro 16″ (Late 2021), Apple M1 Max | iMac 24″ (Early 2021), Apple M1 | iMac 27″ (Mid 2020), Intel Core i9-10910 | iMac 27″ (Mid 2020), Intel Core i9-10910 | |
|---|---|---|---|---|---|
| Write/read speed, MB/s (more is better) | 4113 / 5396 | 7352 / 5454 | 3031 / 2771 | 2998 / 2576 | 2998 / 2576 |
The results of AmorphousDiskMark 3.1 (this is the Mac analogue of the well-known CrystalDiskMark utility) confirm the observations: in the upper screenshot on the left is the new MacBook Pro 14″, on the right is the MacBook Pro 16″. And even lower, for comparison, Mac mini based on Apple M1 and iMac 27″.
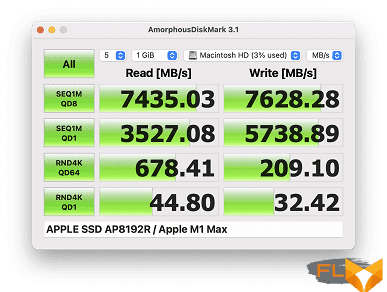
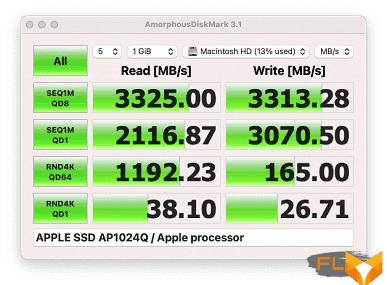
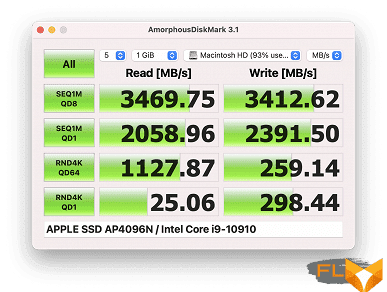
However, the different size of SSD in the compared computers strongly affects here: 8 TB for the MacBook Pro 16 ″ we tested earlier versus 1 TB for the MacBook Pro 14 ″.
In general, the performance picture turned out to be very ambiguous. In some tests, the difference between the younger Apple M1 Pro and the older Apple M1 Max was not traced at all (especially for modes that use only one CPU core), but somewhere, on the contrary, the differences were quite significant.
Heat, noise and battery life
We measure the noise level in a special soundproof and semi-dampened chamber. At the same time, the sound level meter microphone is located relative to the laptop in such a way as to imitate the typical position of the user’s head: the screen is tilted back by 45 degrees (or to the maximum, if the screen does not recline by 45 degrees), the microphone axis coincides with the normal emanating from the center of the screen, the front end of the microphone is located at a distance of 50 cm from the plane of the screen, the microphone is directed at the screen. The load on the CPU is created using the console command:
CPU=$(sysctl -n hw.ncpu)
seq $CPU | xargs -I{} -P $CPU yes > /dev/null
The load on the GPU is created using the FurMark 3D test. The screen brightness is set to maximum, the room temperature is maintained at 24 degrees, but the laptop is not specially blown, so in the immediate vicinity the air temperature may be higher. To estimate the real consumption, we also give (for some modes) the consumption from the network. The battery is pre-charged to 100%.
| Load Scenario | Noise level, dBA | Subjective evaluation | Power consumption, W |
|---|---|---|---|
| Inactive | background(16,2) | conditionally silent | 15 |
| Max CPU load | 29,2 | quiet | 53 (maximum 57) |
| Maximum CPU and GPU load | 41,0 | very noisy | 76 (max 76) |
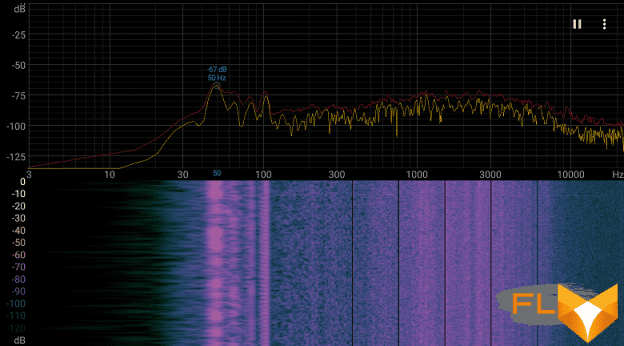
If the laptop is not loaded at all, then its cooling system can work in passive mode. In the case of a heavy load only on the processor, the noise from the cooling system is moderate. If you load the CPU and GPU to the maximum at the same time, then the volume of the cooling system becomes high, but on real tasks it is almost impossible to achieve such an effect. In any case, the nature of the noise is even and does not cause irritation. The spectrogram obtained in the case of maximum load is quite even, and there are no pronounced peaks in the frequency range where sounds can cause particular irritation:
For a subjective assessment of the noise level, the following scale is applicable:
| Noise level, dBA | Subjective evaluation |
|---|---|
| Less than 20 | conditionally silent |
| 20-25 | very quiet |
| 25-30 | quiet |
| 30-35 | clearly audible |
| 35-40 | noisy |
| 40-45 | very noisy |
| 45-50 | loud |
| Above 50 | very loud |
Below 20 dBA, the computer is conditionally silent; from 20 to 25 dBA, a laptop can be called very quiet; 35 dBA noise is clearly audible, 35 to 40 dBA noise exceeds the comfortable level for long-term work, 40 to 45 dBA the laptop is very noisy and needs to be masked by background music, for example, 45 to 50 dBA noise level is very uncomfortable, and 50 dBA and above, the noise is so loud that headphones must be used. The scale, of course, is very conditional and does not take into account the individual characteristics of the user and the nature of the sound.
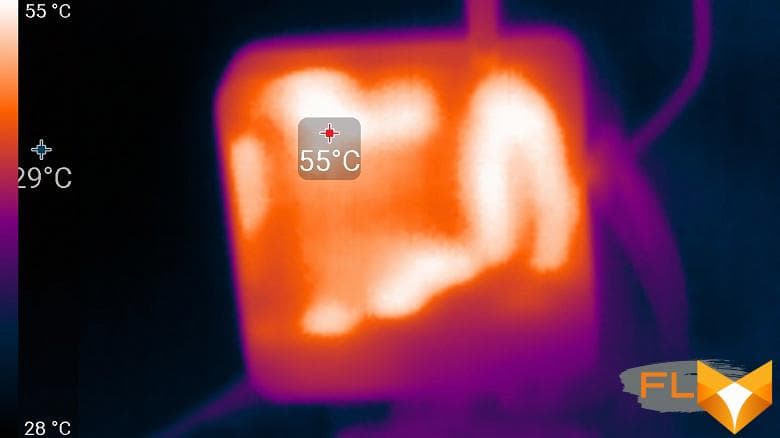
Below are thermal images obtained after 30 minutes of work with the maximum load on the CPU and GPU:
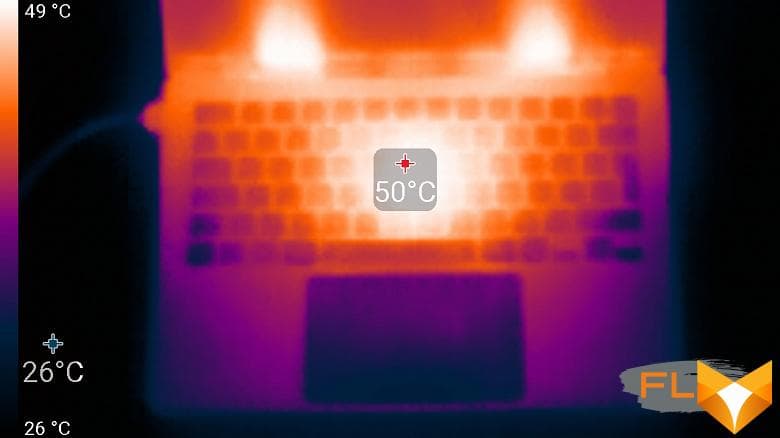
Maximum heating is conditionally in the center of the keyboard and in two areas at the bottom of the screen, where hot air is blown. Where the user’s wrists are usually located, heat is also felt, which somewhat reduces the comfort of working with a laptop.

The heating from below is quite high, and if you hold the laptop on your lap, you feel warm, in the heat it will be uncomfortable to work like that. The power supply gets very hot, so when working with high performance for a long time, you must make sure that it is not covered by anything:
Of course, one of the most interesting questions about Apple Silicon laptops is battery life. We tested the MacBook Pro 14″ in Full HD YouTube video playback and 3D gaming mode. True, as the latter, we had to use not the Geeks 3D GPU Test Tessmark x64 stress test, like the rest of the models in comparison, but the GFXBench battery benchmark, since we simply did not run the Geeks 3D GPU Test. Nevertheless, the result turned out to be very plausible.
| MacBook Pro 14″ (Late 2021), Apple M1 Pro | MacBook Pro 16″ (Late 2021), Apple M1 Max | MacBook Pro 13″ (Late 2020), Apple M1 | MacBook Pro 16″ (Late 2019), Intel Core i9-9980HK | |
|---|---|---|---|---|
| 3D Game Mode | 2 hours 3 minutes | 2 hours 13 minutes | 2 hours 42 minutes | 1 hour 22 minutes |
| View Full HD YouTube video running in Safari (screen brightness 100 cd/m²) | 17:50 | 20 hours 20 minutes | 25 hours 45 minutes | 8 hours 40 minutes |
In general, the alignment is as follows: MacBook Pro 13″ is the longest-running laptop due to the energy-efficient (but not very productive) M1 chip. In second place is the significantly more powerful MacBook Pro 16″, which at the same time has a fairly capacious battery. Third place went to the MacBook Pro 14″, which runs on a slightly smaller battery than the MacBook Pro 16″, which is explained by its less capacious battery. Finally, far behind the previous generation MacBook Pro 16″. And here it is, of course, the energy efficiency of the “stuffing”.
Full charging time, like the MacBook Pro 16″, is just over an hour and a half.
Conclusions
Of all current Apple laptops, the new MacBook Pro 14″ demonstrates the best combination of price, convenience and performance. Yes, in a number of tests it lost to the flagship MacBook Pro 16″ (although not in all), but the price is much higher and the case is less mobile. In turn, the MacBook Pro 13″ based on the Apple M1 is more energy efficient, but in terms of performance it is significantly weaker, and the lack of an HDMI output and a memory card slot makes it less convenient for professional use (for example, if you are a photographer or often give presentations ).
If we disregard comparison with other MacBooks and evaluate the 14-inch model in the minimum configuration as such, then we cannot but admit that this is a very good device that pleases with exceptionally high performance, an excellent screen with a minimal frame, a comfortable keyboard, a decent set of connectors (for a full happiness is not enough except for a full-sized USB) and excellent battery life.
For work use, involving a high degree of mobility (business trips, and just traveling around the city with a laptop), this is the best option. Of course, provided that you are satisfied with the macOS environment (you can’t put Windows here) and the price of a laptop seems affordable – to put it mildly, a lot.
Most Popular Articles
Review of the laptop HUAWEI MateBook 13 AMD (HN-W19R): the ideal was so close
Review of the gaming laptop Predator Triton 500 SE from Acer: powerful, adult, thin
4k Uhd Monitor Review Samsung UJ59 – uj59 4k Monitor Samsung u32j590
ASUS ExpertBook B9 B9400CEA ultrabook review: when 18 hours weigh 1 kilogram
Laptops with sim card slot – Best laptop with a sim card slot in 2024 lte

T10 Best Graphics Cards Under 500 for Gaming in 2024 Gpus For Every Budget